Login
Login


What are the definitions for the Lettings KPIs?
The Lettings KPI Statistics are shown below (from left to right as they appear in the grid). Where statistics are for individual branches or negotiators, the system will check for the branch/negotiator assigned to the applicant or property and show the statistic as relevant.
Some statistics will be for current data only and are not for the specified date range. If the date range is used, this is stated in the explanation below.
|
Applicants
|
New applicants entered in the date range |
|
Viewings
|
New viewings booked in the date range |
|
Valuations
|
New valuations booked in the date range |
|
Instructions
|
New Instructions added in the date range |
|
Conversion %
|
Percentage of valuations converted into instructions |
|
Total Lets
|
The number of tenancies marked as ‘Let’ in the given date period (regardless of whether it is fully managed, rent collection or let only) |
|
Fully Managed
|
The number of tenancies marked as ‘Let’ in the given date period where the management type is set to Fully Managed |
|
Fully Managed Arrangement Fees
|
Nominal report Arrangement Fees against tenancies posted between the given dates where the management type is set to Fully Managed |
|
Fully Managed Average Fee
|
The average arrangement fee on Fully Managed tenancies posted between the given dates |
|
Rent Collection
|
The quantity of tenancies marked as ‘Let’ in the given date period where the management type is set to Rent Collection |
|
Rent Collection Arrangement Fees
|
Nominal report Arrangement Fees against tenancies posted between the given dates where the management type is set to Rent Collection |
|
Rent Collection Average Fee
|
The average arrangement fee on Rent Collection tenancies posted between the given dates |
|
Let Only
|
The quantity of tenancies marked as ‘Let’ in the given date period where the management type is set to Let Only |
|
Let Only Arrangement Fees
|
Nominal report Arrangement Fees against tenancies posted between the given dates where the management type is set to Let Only |
|
Let Only Average Fee
|
The average arrangement fee on Let Only tenancies posted between the given dates |
|
Total Fully Managed
|
The total number of tenancies marked as ‘Let’ where the management type is set to Fully Managed |
|
Fully managed Fee
|
The total recurring fee for all of the tenancies where the management type is set to Fully Managed |
|
Fully Managed Average Fee
|
The average agency fee across all Fully Managed tenancies |
|
Total Rent Collection
|
The total number of tenancies marked as ‘Let’ where the management type is set to Rent Collection |
|
Rent Collection Fee
|
The total recurring fee for all of the tenancies where the management type is set to Rent Collection |
|
Rent Collection Average Fee
|
The average agency fee across all Rent Collection tenancies |
|
Total Let Only
|
The total number of tenancies marked as ‘Let’ where the management type is set to Let Only |
|
Total Income
|
This is the nominal report of all agency fees and all arrangement fees posted between the specified date range |
|
Available Stock
|
The total number of ‘Available to Let’ properties |
|
Reserved Tenancies
|
All tenancies with a status of ‘Reserved’ (regardless of date range) |
What are the definitions for the Sales KPIs?
Where the statistics are provided for each individual branch or negotiator, this will be the one that is assigned to the applicant or property. Where this is not the case it is stated in the definition.
|
Item |
Explanation |
|
Apps |
Number of applicants where Date Entered falls in the date range (for both sales and lettings Departments). |
|
View |
Number of viewings for sales department properties where the Appointment Date is in the date range split by Viewing branch |
|
View Fthru |
Number of viewings for sales department properties where the Appointment Date is in the date range with a status of Cancelled, split by Viewing branch |
|
View Fthru Percent |
View Fthru / View as a percentage |
|
Vals |
Number of valuation appointments for sales department properties where the Appointment Date is in the date range, split by Appointment branch |
|
Inst |
Number of Properties where Instructed on date is in date range. |
|
Convert Percent |
Inst / Vals as a percentage |
|
Mkt Fee |
Total (Price * fee percentage) or fixed fee sales department properties instructed in the date range. |
|
Ave Ins Fee |
Mkt Fee / Inst as a percentage |
|
Wdrw |
Number of sales department Properties where Withdrawn date is in date range. |
|
Sale |
Number of Offers where Offer Accepted Date is in the date range and offer status is not rejected |
|
Sale Fee |
Total (Offer Value * fee percentage) or fixed fee offers on sales department properties where Offer Accepted Date is in the date range and offer status is not rejected. Split by property branch. |
|
Ave Sale Fee |
Sale Fee / Sale as a percentage |
|
Fthru |
Number of Offers where Cancelled Date is in the date range |
|
Fthru Fee |
Total (Offer Value * fee percentage) or fixed fee offers on sales department properties where Cancelled Date is in the date range. Split by property branch. |
|
Net Sales |
Sales Fee - Fthru Fee |
|
Exch |
Number of Offers for sales department properties where Exchanged Date is in the date range. Split by property branch. |
|
Exch Fee |
Total (Offer Value * fee percentage) or fixed fee for sales properties where Exchanged Date is in the date range. Split by property branch. |
|
Ave Exch Fee |
Exch Fee / Exch as a percentage |
|
Pipe |
Current Number of Offers on sales department properties with status of Accepted or Exchanged and Property Status is On Market, Under Offer or Sold STC and Completion Date is not completed and offer date after 1 July 2005. Split by property branch. |
|
Pipe Fee |
Current Total (Offer Value * fee percentage) or fixed fee offers on sales department properties with offer status of Accepted or Exchanged and Property Status of On Market, Under Offer, Sold STC and the Completion Date is not completed and offer date is after 1 July 2005. Split by property branch. |
|
Ave Pipe Fee |
Pipe Fee / Pipe as a percentage |
|
Stock |
Current number of on sales department Properties with status of On Market or Under Offer |
|
Stock Fee |
Total (Price * fee percentage) or fixed fee where on sales department properties have a status of On Market or Under Offer
|
What are the definitions for the Statistics option?
This list of definitions relates to the option from the Reporting menu called ‘Statistics’.
Where statistics are for individual branches or negotiators, the system will check for the branch/negotiator assigned to the applicant or property and show the statistic as relevant. Where this is not the case it is stated in the definition.
Some statistics will be for all current data (eg “Live Applicants”) and are not for the specified date range. If the date range is used, this is stated in the explanation below.
New Applicants
|
Item |
Explanation |
|
New Applicants |
Number of applicants where Date Entered falls in the date range. |
|
With an Average Maximum Price Of |
Total Max Price / Number of New Applicants |
Applicant Enquiry Sources
|
Item |
Explanation |
|
Enquiry Source Item 1 |
Number of applicants added in period with enquiry source item 1 selected. |
|
Enquiry Source Item 2… |
… |
Applicant Enquiry Methods
|
Item |
Explanation |
|
Enquiry Method Item 1 |
Number of applicants added in period with enquiry method item 1 selected. |
|
Enquiry Method Item 2… |
… |
Live Applicants
|
Item |
Explanation |
|
Live Applicants |
|
|
Total Applicants |
Number of Applicants currently in the system regardless of status. |
|
Last Contact Average (Days) |
Average number of days between the last contact date and today for all active applicants. |
|
Average Maximum Price |
Average maximum price (Send To value in applicant record) for all active applicants. |
Applicant Viewing and Offer Statistics
|
Item |
Explanation |
|
Viewings |
Number of viewings where the Event Date is in the date range split by Viewing branch / negotiator |
|
Viewings as % of Apps |
Number of Viewings in date range / Live Applicants |
|
Offers |
Number of Offers where the Offer Date is in the date range split by Offer negotiator / branch |
|
Offers as % of Apps |
Number of Offers in date range / Live Applicants |
Property Statistics
New Instructions
|
Item |
Explanation |
|
Free Valuations |
Number of Valuations where Valuation Done date in date range. |
|
New Instructions |
Number of Properties where Instructed on date is in date range. |
|
Instructions as % of Valuations |
New Instructions / Free Valuations |
|
Average % Fee |
Total fee percentage / number of properties for On Market properties that were instructed in the date range and have a percentage fee type and a fee and price added. |
|
Average Anticipated Income From Above |
Total (Price * fee percentage) / number of properties for On Market properties instructed in the date range, have a percentage fee type and a fee and price added. |
|
Average Fixed Fee £ |
Total Fee / number or properties for On Market properties instructed in the date range, have a fixed fee type and a fee and price added. |
|
Average Asking Price |
Total Price / number of properties where Instructed on date is in date range. |
Total Property Register Statistics
|
Item |
Explanation |
|
Total On Market Properties |
Total number of properties where the current status is On Market. |
|
Average % Fee |
Total fee percentage / number of properties for On Market, Under Offer, Sold STC, Withdrawn, Exchanged and Completed properties and have a percentage fee type and a fee and price added. |
|
Average Anticipated Income From Above |
Total (Price * fee percentage) / number of properties * for On Market, Under Offer, Sold STC, Withdrawn, Exchanged and Completed properties and have a percentage fee type and a fee and price added. |
|
Average Fixed Fee |
Total Fee / number or properties for On Market, Under Offer, Sold STC, Withdrawn, Exchanged and Completed properties and have a percentage fee type and a fee and price added. |
|
Average Asking Price |
Average Price for all properties regardless of status where a price has been added. |
Withdrawn Properties
|
Item |
Explanation |
|
Number of Properties Withdrawn |
Number of properties with status of Withdrawn where withdrawn date is in date range. |
|
Net Register Gain |
New Instructions – Number of Properties Withdrawn |
|
Withdrawns as % of New Instructions |
Withdrawn / New Instructions |
|
Average Time On Market (Days) |
Average Withdrawn date – Instructed On Date of properties with a status of Withdrawn where Withdrawn Date is in the date range. |
|
No. Viewings Till Withdrawn |
Total number of viewings for properties with status of Withdrawn where withdrawn date is in date range. |
|
No. Matches Till Withdrawn |
Total number of matches where details were posted for properties with status of Withdrawn where withdrawn date is in date range. |
|
Price Changes Whilst On Market |
Total number of price changes for properties with status of Withdrawn where withdrawn date is in date range. |
Sold STC Properties
|
Item |
Explanation |
|
Total Properties Sold STC |
Total number of properties with status of Sold STC. This is a snapshot of the data when the statistics are produced, not for the selected date range. |
|
Average Price |
Total Price / Number of properties with status of Sold STC. This is a snapshot of the data when the statistics are produced, not for the selected date range. |
|
Possible Revenue |
Total fee using either fixed fee or Percentage * Asking Price for all properties with a status of Sold STC, where price and fee details have been completed. This is a snapshot of the data when the statistics are produced, not for the selected date range. |
|
New Properties Sold STC |
Number of properties where their Sold STC Date is within the date range. |
|
Average Price |
Total property Price / Number of properties where their Sold STC Date is within the date range. |
|
Possible Revenue |
Total fee using either fixed fee or Percentage * Asking Price of properties where the Sold STC Date is within the date range. |
|
Average Time On Market (Days) |
Average Sold STC Date – Instructed On Date for properties with a status of Sold STC and where their Sold STC Date is within the date range. |
|
Average Viewings To Sold STC |
Total number of viewings for properties currently with a status of Sold STC (not for the date range) |
|
Average Matches To Sold STC |
Total number of matches where details were posted for properties currently with a status of Sold STC (not for the date range) |
|
Average Offers To Sold STC |
Total number of offers for properties currently with the status of Sold STC (not for the date range) |
|
Sold STC Lost |
Total number of properties where the Sold STC date are in the date range and now have a status of On Market, Under Offer, Withdrawn or Sold by Another Agent. |
|
Net Gain |
New Properties Sold STC - Sold STC Lost |
|
Fall Through Rate |
Sold STC Lost / New Properties Sold STC |
Exchanged & Completed Properties
|
Item |
Explanation |
|
Number of Properties Exchanged |
Number of properties where the Exchanged Date is within the date range. |
|
Average Days From Sold STC To Exchanged |
Average Exchanged Date – Sold STC date for properties where the Exchange Date is in the date range. |
|
Average Price |
Total property Price / Number of properties where their Exchanged Date is within the date range. |
|
Possible Revenue |
Total fee using either fixed fee or Percentage * Asking Price of properties where the Exchanged Date is within the date range. |
|
Number of Properties Completed |
Number of properties where the Completed On Date is within the date range. |
|
Average Days From Exchanged To Completed |
Average Completed On Date - Exchanged Date for properties where the Completed On Date is in the date range. |
What is the best way to quickly e-mail property details to existing applicants when they request them?
The easiest way to quickly e-mail property details to an existing applicant is through the Property Presentation tool.
This doesn't just send them the brochure, but the full property details. The e-mail having been sent also gets recorded in Expert Agent against their record and the property record - so you have accurate information to refer to when looking at how many people have been sent particular properties. If they are in the office with you, you can use the Property Presentation tool to actually go through the properties with them instantly on the screen - selecting in the process which properties you would like to then send.
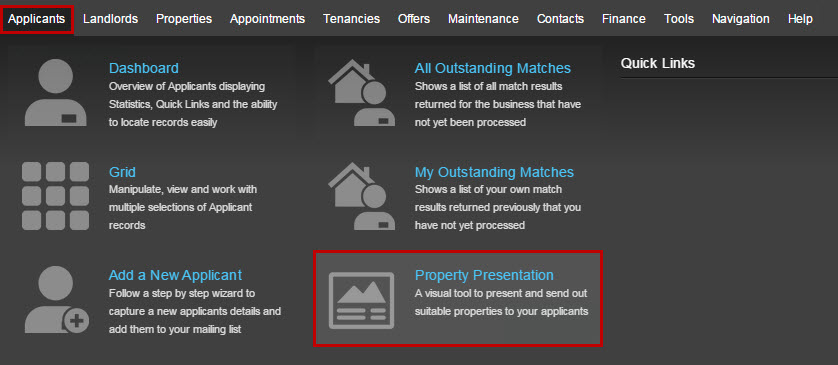
You get to the Property Presentation tool from the Applicants top menu:
This example assumes that the request for the details has come from somebody who is already on your applicant list. If in doubt, you can check using the 'Find Applicant' box. The process differs slightly if they aren't already on your mailing list - see the How do I e-mail a brochure to a casual enquiry? FAQ for information on this.
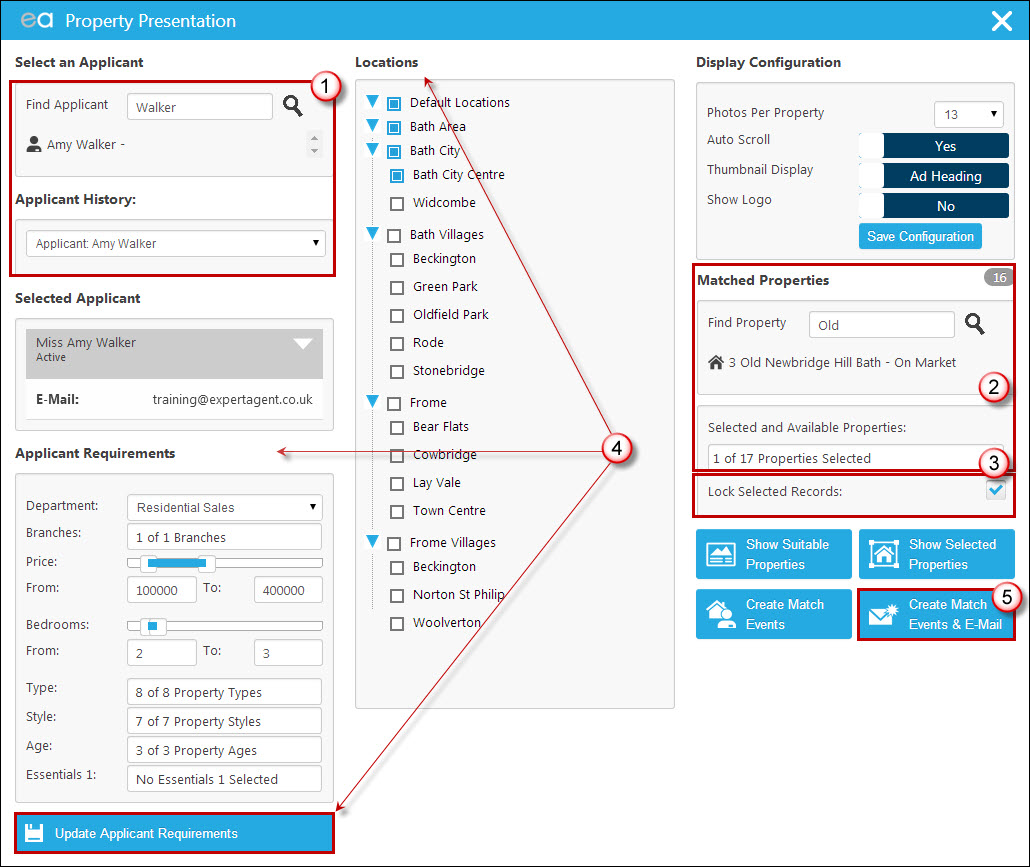
1. Select the applicant by either using the 'Find Applicant' field or selecting them from the Applicant History section.
2. Select the property you would like to send them. It's likely they'll have given you the property address(es), in which case you'll be able to use the 'Find Property' box to search for the property. Clicking on the properties name when it appears underneath the search box will add it to the list in the 'Selected and Available Properties' section.
3. It is worth asking the applicant if they would like details of any other similar properties - they may not, in which case you would skip this step, however if they do you can look through the 'Selected and Available Properties' drop down on the right hand side and tick any that you would also like to send. It is crucial that before you do this, however, you have ticked the 'Lock Selected Records' option on the right hand side so that you don't lose your manually selected property.
4. The system should already know their requirements if they are an applicant who has already registered with you, and this will be what it uses to populate the 'Selected and Available Properties' drop down. Their requirements will be listed on the left hand side so that they can be amended if necessary. Tick 'Update Applicant Requirements' if you make any changes to save these changes to their applicant record.
5. Click 'Create Match Events and E-Mail'.
Your standard match e-mail template will open for you to add a subject, and send.
The Property Presentation tool is not only brilliant for quickly sending brochures, but for visually displaying properties in your offices, using for matching and so on. For a more detailed explanation of how the rest of the Property Presentation tool works, see the NOT ADDED YET chapter.
Tel: 01225 303500 | Email: account.managers@webskyltd.com
Terms of Business | Cookie Policy | Privacy Policy | ZPG Modern Slavery Statement
Designed by the Expert Agent Design Department